A Digital Hearth for Community Wellbeing: The Santa Barbara County Community Wellbeing Dashboard
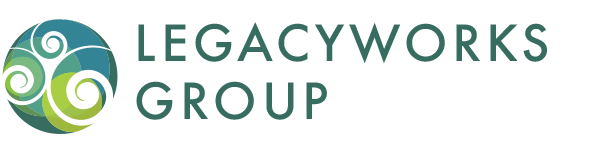
Santa Barbara County community members collaborating during a workshop | Photo by Melissa Fontaine
From quiet schoolyards to strained hospital waiting rooms in 2020, Santa Barbara County faced profound challenges. With little data available about the pandemic itself and about the impact it was having, community leaders struggled to make sense of the challenges and take informed action to address them. The pandemic revealed a long-standing structural reality: critical community data was fragmented across departments, agencies, nonprofits, and hard-to-access systems, leaving us to navigate complex challenges with only parts of the picture.
In that moment of crisis, LegacyWorks stepped forward to organize a collaborative effort to create a community dashboard that could integrate data on the pandemic and its impact on community members, while also helping connect residents to resources. Although the original pandemic-inspired dashboard was eventually shuttered, five years later, with support from the Santa Barbara Foundation and the active engagement of over 100 organizations and agencies across the County, the effort has been reborn as the Santa Barbara County Community Wellbeing Dashboard. Today, participating partners envision the dashboard as a new kind of digital hearth—a shared civic space where data and story create insights to guide decision-making, investment, and action.
The renewed dashboard went live in December with the launch of two focus areas, Housing and Economic Security, combining data visualizations and stories of the work being done to improve wellbeing in these vital areas. Thanks to funding from a growing consortium of funders including the Santa Barbara Foundation, the Schiele Foundation, the Natalie Orfalea Foundation and the Towbes Foundation, work is underway on Health and Food Security now, with completion expected this summer. As funding becomes available, we plan to advance Education, Sustainable Ecosystems, Community Connectedness, and Peace and Justice in the coming years.
More than a repository of data, the dashboard is designed as connective tissue for the region—a shared source of truth grounded in story, context, and community voice. “It’s not all widgets, dials, and graphs,” says Sophie Bartley, LegacyWorks Central Coast Project Manager. “The dashboard is rich with people's stories that bring the data to life. That combination enables the dashboard to show how we as a community are meeting our most critical needs.”
Making this vision a reality requires authentic community engagement and the collaboration of dozens of organizations and agencies. To make that possible, the dashboard team facilitates a series of community workshops for each focus area, bringing together diverse stakeholders to explore what Project Manager Elle Shafer describes as the parallel “science and art” of the dashboard. On the science side, participants narrow broad regional goals into focused impact statements - such as ensuring universal access to nourishing food. Then they develop data-driven metrics to track collective progress achieving them. On the art side, our team leads partners through interactive exercises to turn abstract data into clear and engaging visualizations and to weave stories in to bring the data to life.
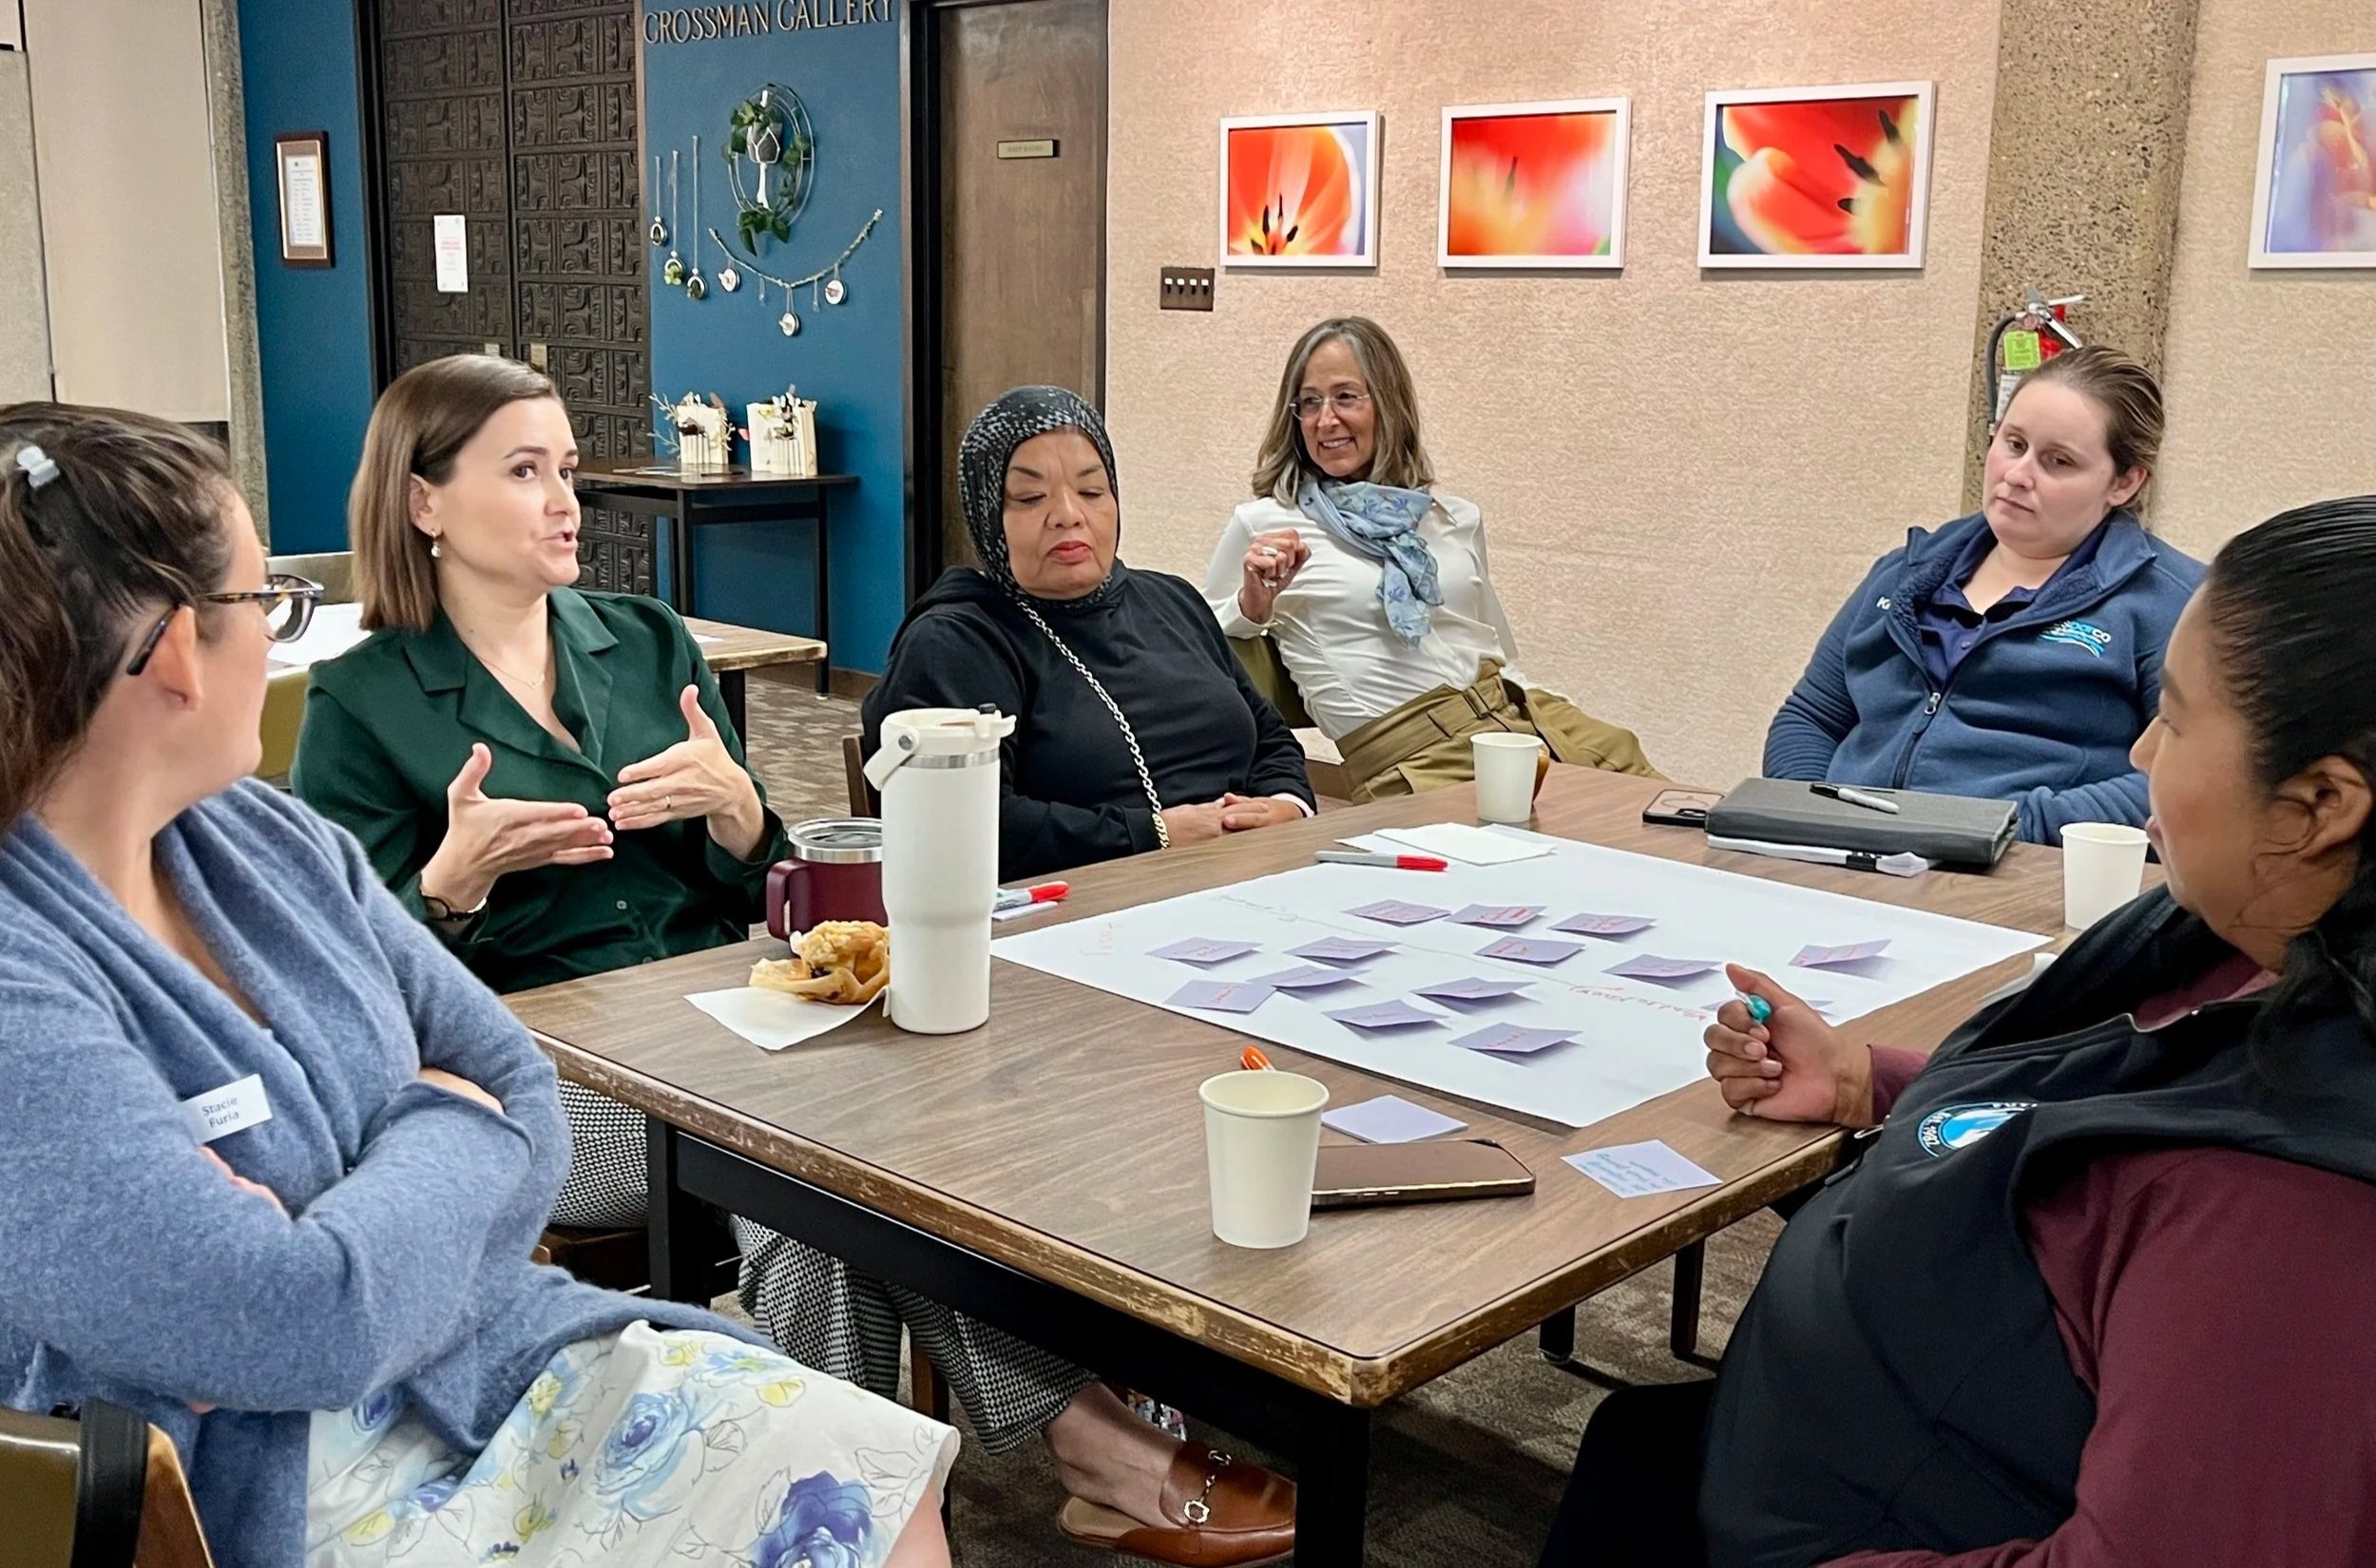
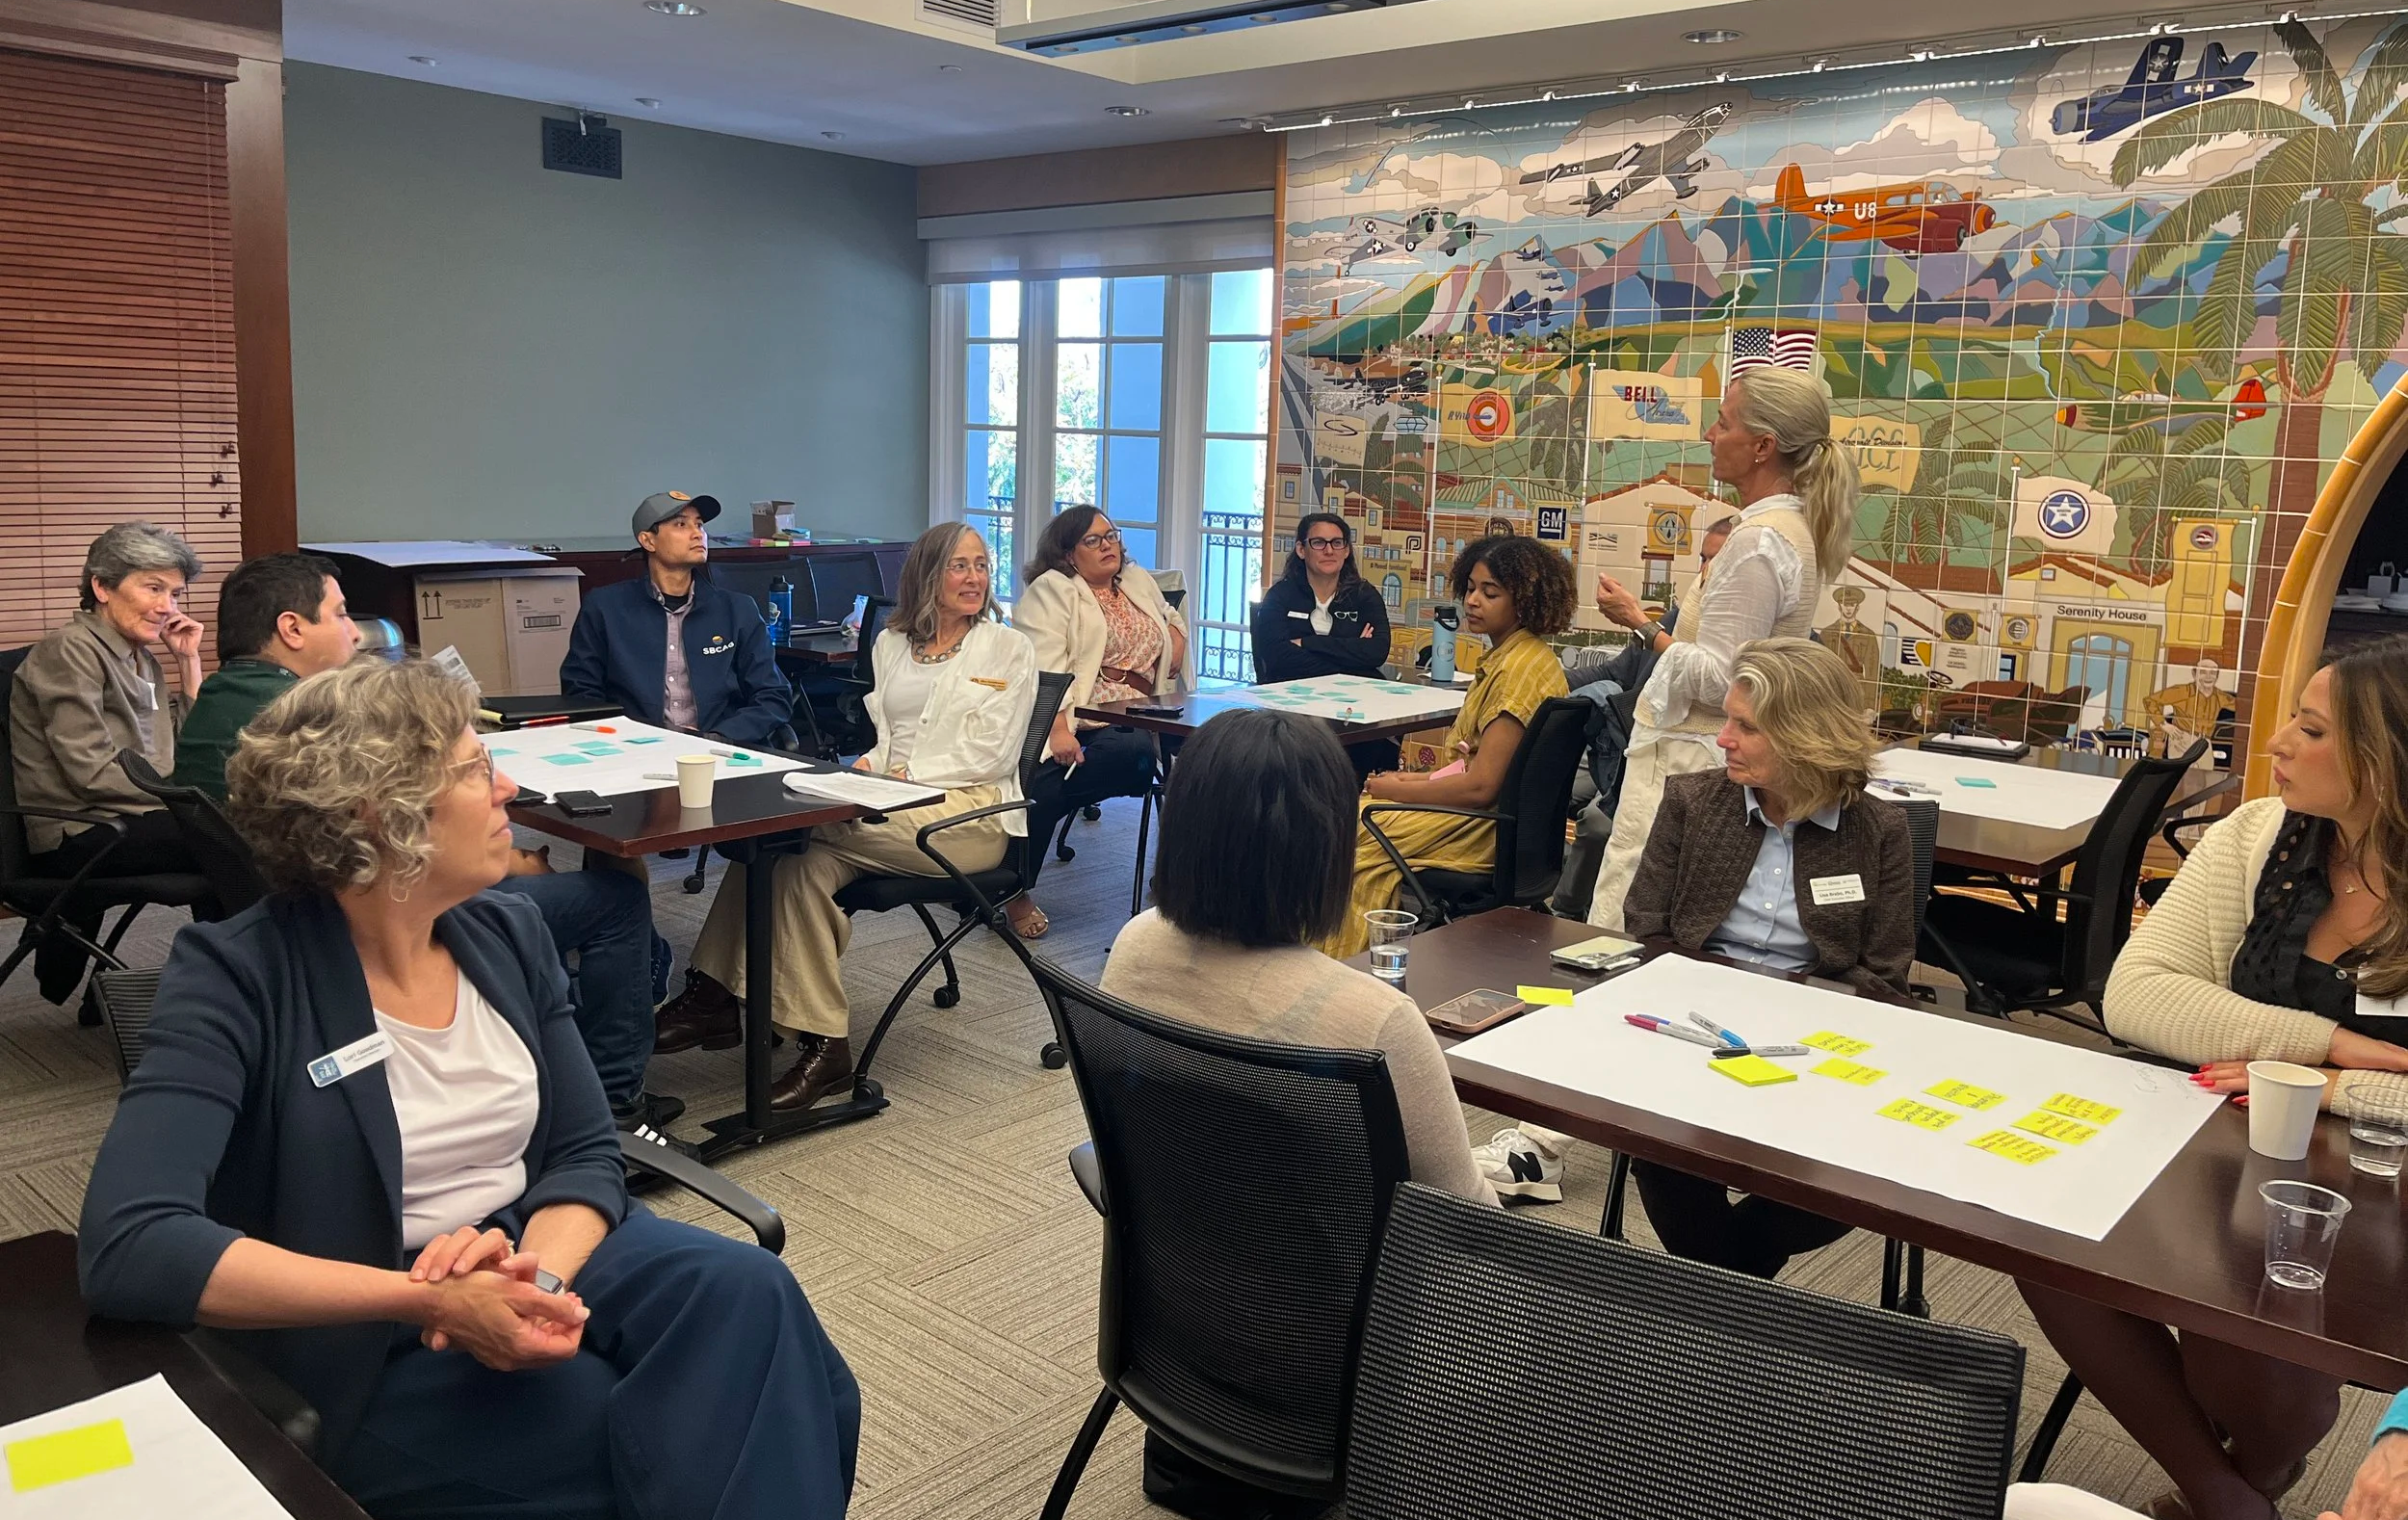
Team members gather for an initial planning session on Housing and Economic Security | Photo by Melissa Fontaine
This facilitated, collaborative co-creation starts with an initial digital prototype that evolves as the partners continue to work together to gather, interpret, and share data over time. This results in a living resource that the community truly owns. “Anyone can create a website,” Elle notes. “The real work is building the cross-sector relationships that allow our partners to make the data meaningful.”
Stacie Furia, Senior Director of Evaluation and Learning at the Santa Barbara Foundation, describes this as a “mutual discovery” process. “Each individual might have some idea of what exists in the community, but others aren’t always familiar with it,” she explains. “These engagements give people the opportunity to talk about the data while also hearing from each other.” In these conversations, clearer pictures emerge and the focus begins to shift from isolated efforts to coordinated action. The dashboard’s real power lies not simply in the information it holds, but in the relationships and alignment it helps foster.
This spirit of alignment is mirrored internally in the synergy between LegacyWorks Group’s Consulting and Central Coast teams. The dashboard relies on a deliberate pairing of strengths: the Consulting team brings technical expertise in process design, data representation, and dashboard development. The Central Coast team facilitates the process to build trust, strengthen networks, and surface opportunities to collaborate to improve wellbeing.
Later this year LegacyWorks and our partners plan to launch a Community Dashboard Steering Committee to guide the ongoing evolution of the dashboard as a living resource shaped by and for the community. The Steering Committee will play a central role stewarding the growing network of partners and the trust-based relationships at the heart of the dashboard collective, thereby ensuring collective ownership. Stay tuned for the Food Security and Health focus areas later this year as the community continues to build the dashboard and a brighter future together.