Vaccination data added to Community Dashboard
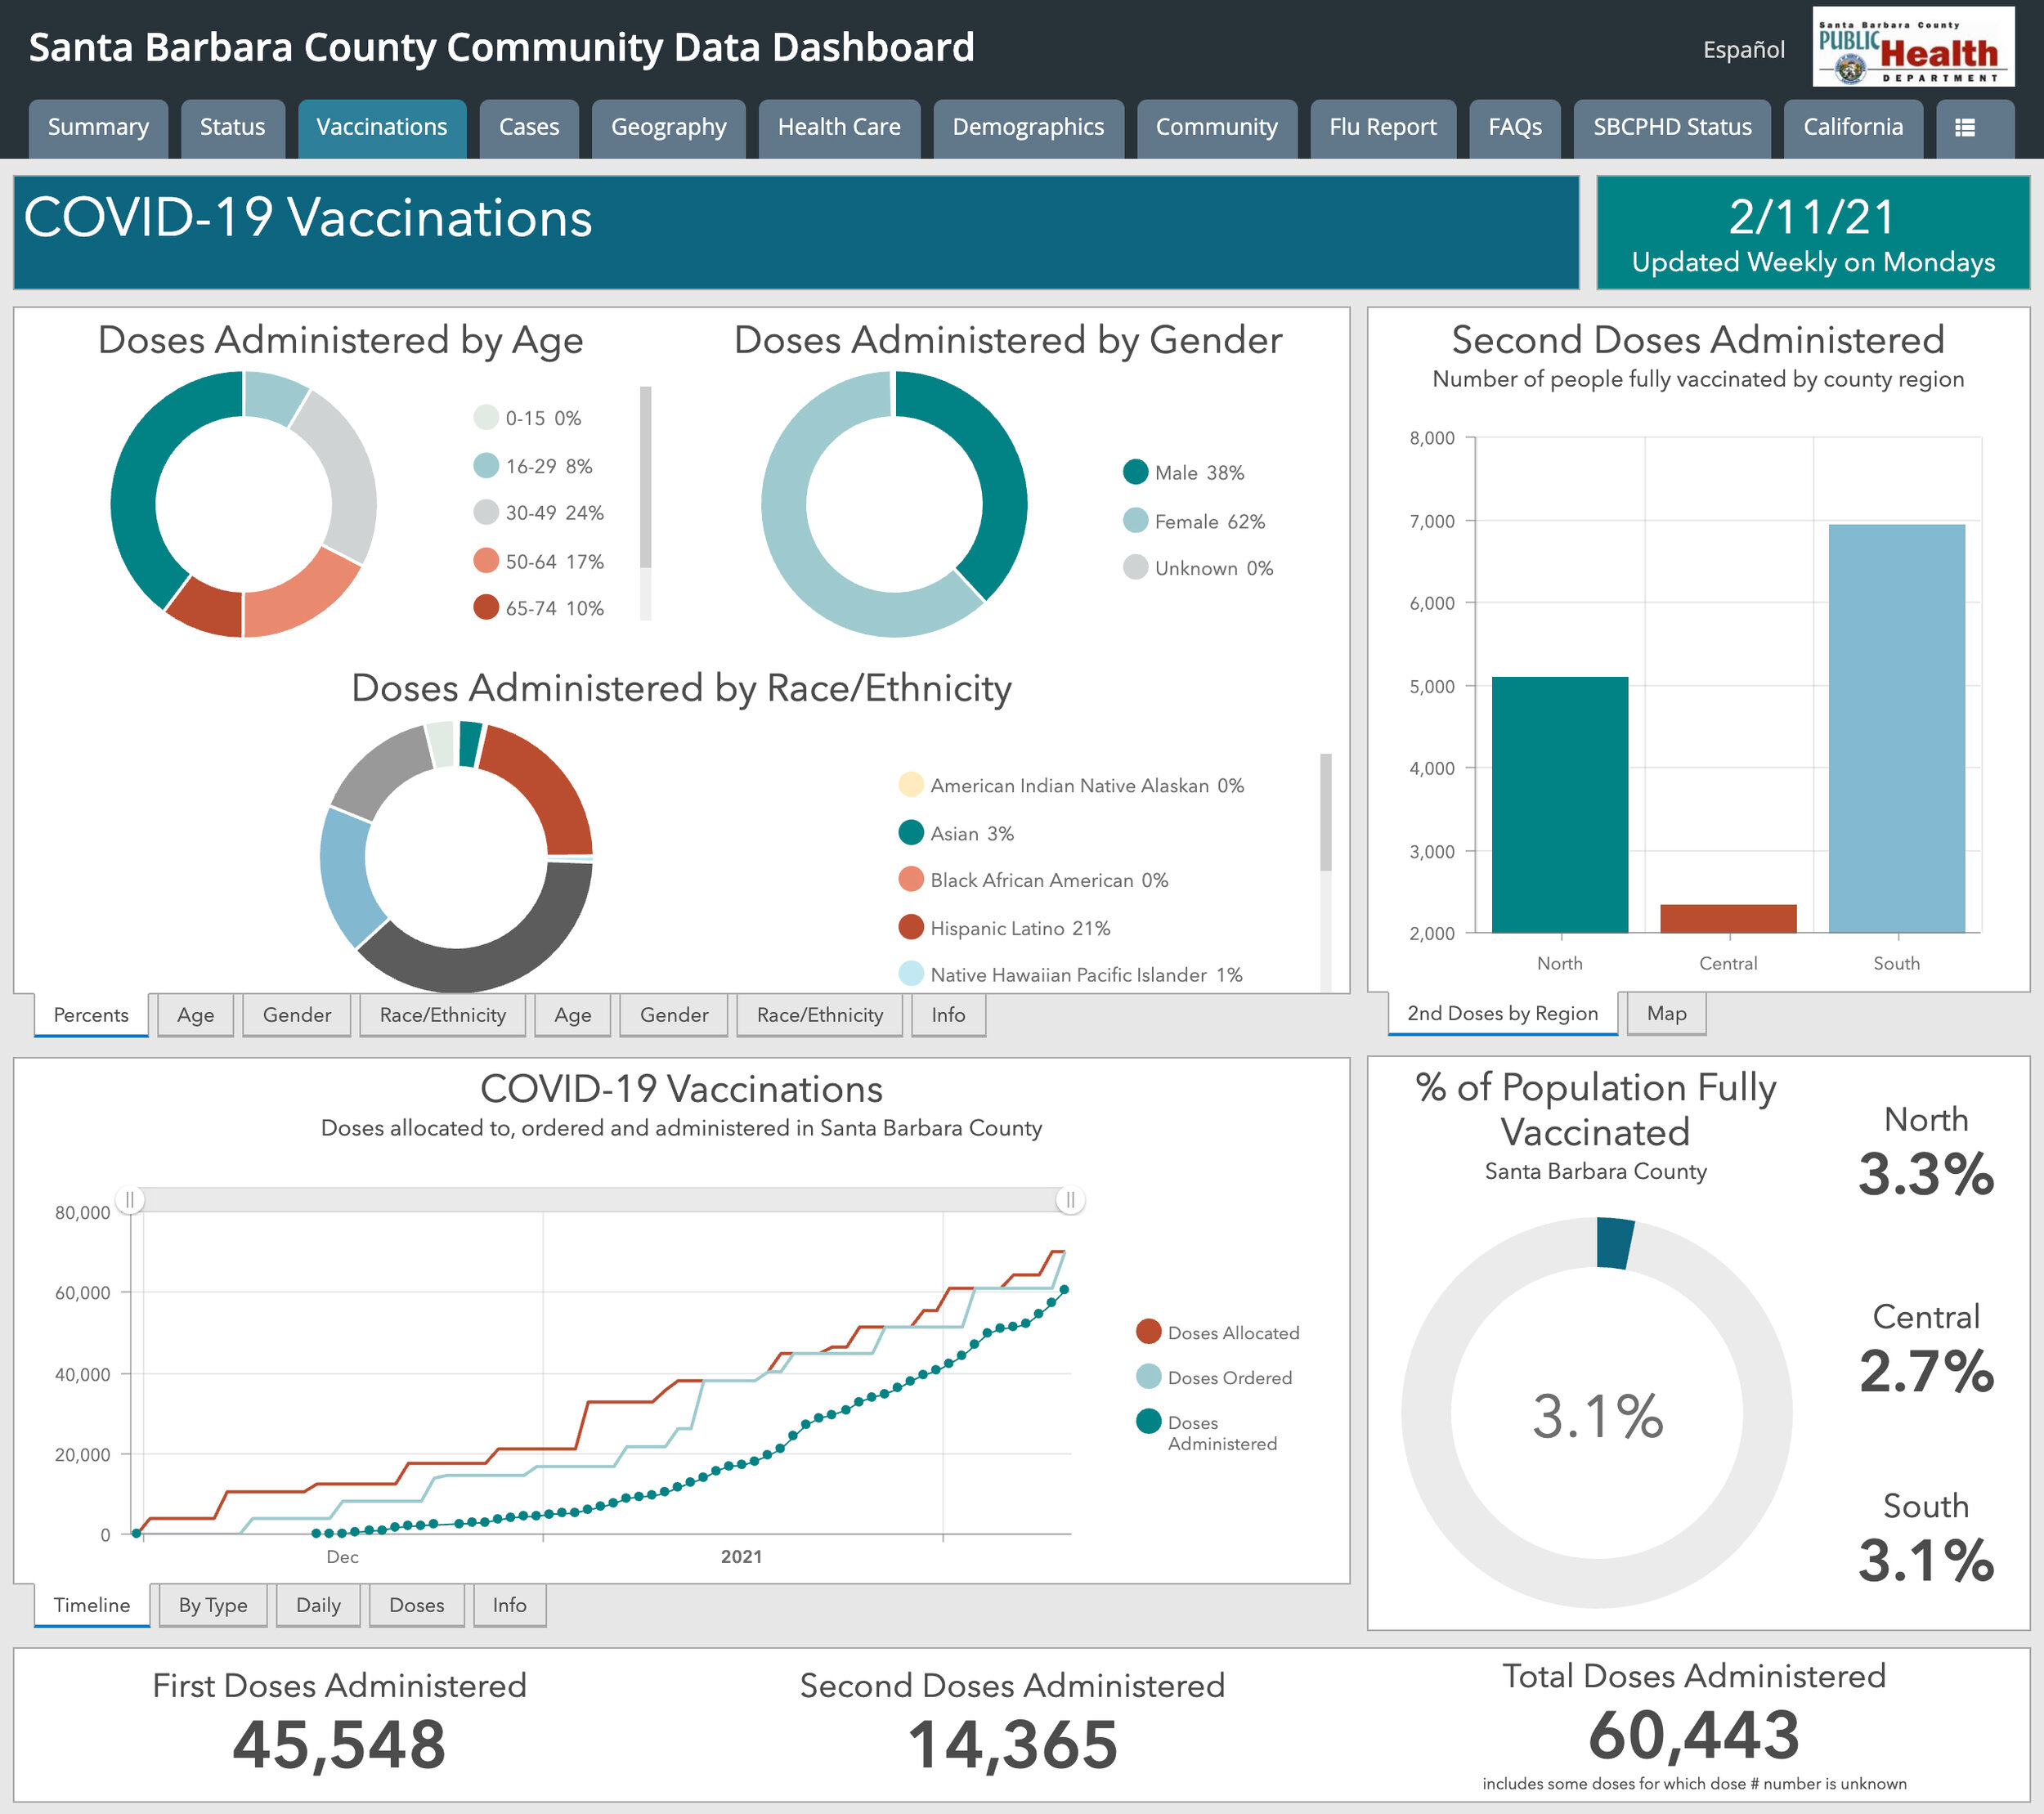
Three months ago we launched the The Santa Barbara Community Data Dashboard. Since then we have worked closely with the County Public Health Department to refine and adapt the dashboard as the State changed policies and set, then lifted restrictions. While we began reporting some vaccination data in mid-January, today we are excited to unveil a more robust COVID-19 Vaccination Dashboard including recipient demographics, numbers of vaccinations administered, the percent of the population of Santa Barbara County who are fully vaccinated, and more.
The expanded vaccination dashboard will track our progress in the coming months as we vaccinate our most vulnerable community members and later the broader community. Like the overall dashboard, we hope it will guide decision makers and inform us all as this massive vaccination effort unfolds.
In addition to the new vaccine data, the dashboard’s ongoing goal is to paint an increasingly clear picture of our community’s well being and resilience. We hope to add more relevant data such as how much childcare capacity we have as a community and how affordable it is, how much housing we have compared to what we need, how much relief funding has come to the County and how it has been used, and much more. We believe access to a broad array of important and frequently updated data will help us all build a more resilient community by being better prepared to address emerging priorities, chronic challenges and acute crises in the coming months and years.
We are grateful to the County and all of our partners and funders for their many contributions to this critical community resource. We couldn’t have done it - or keep doing it - without you.