
Tracking Variants
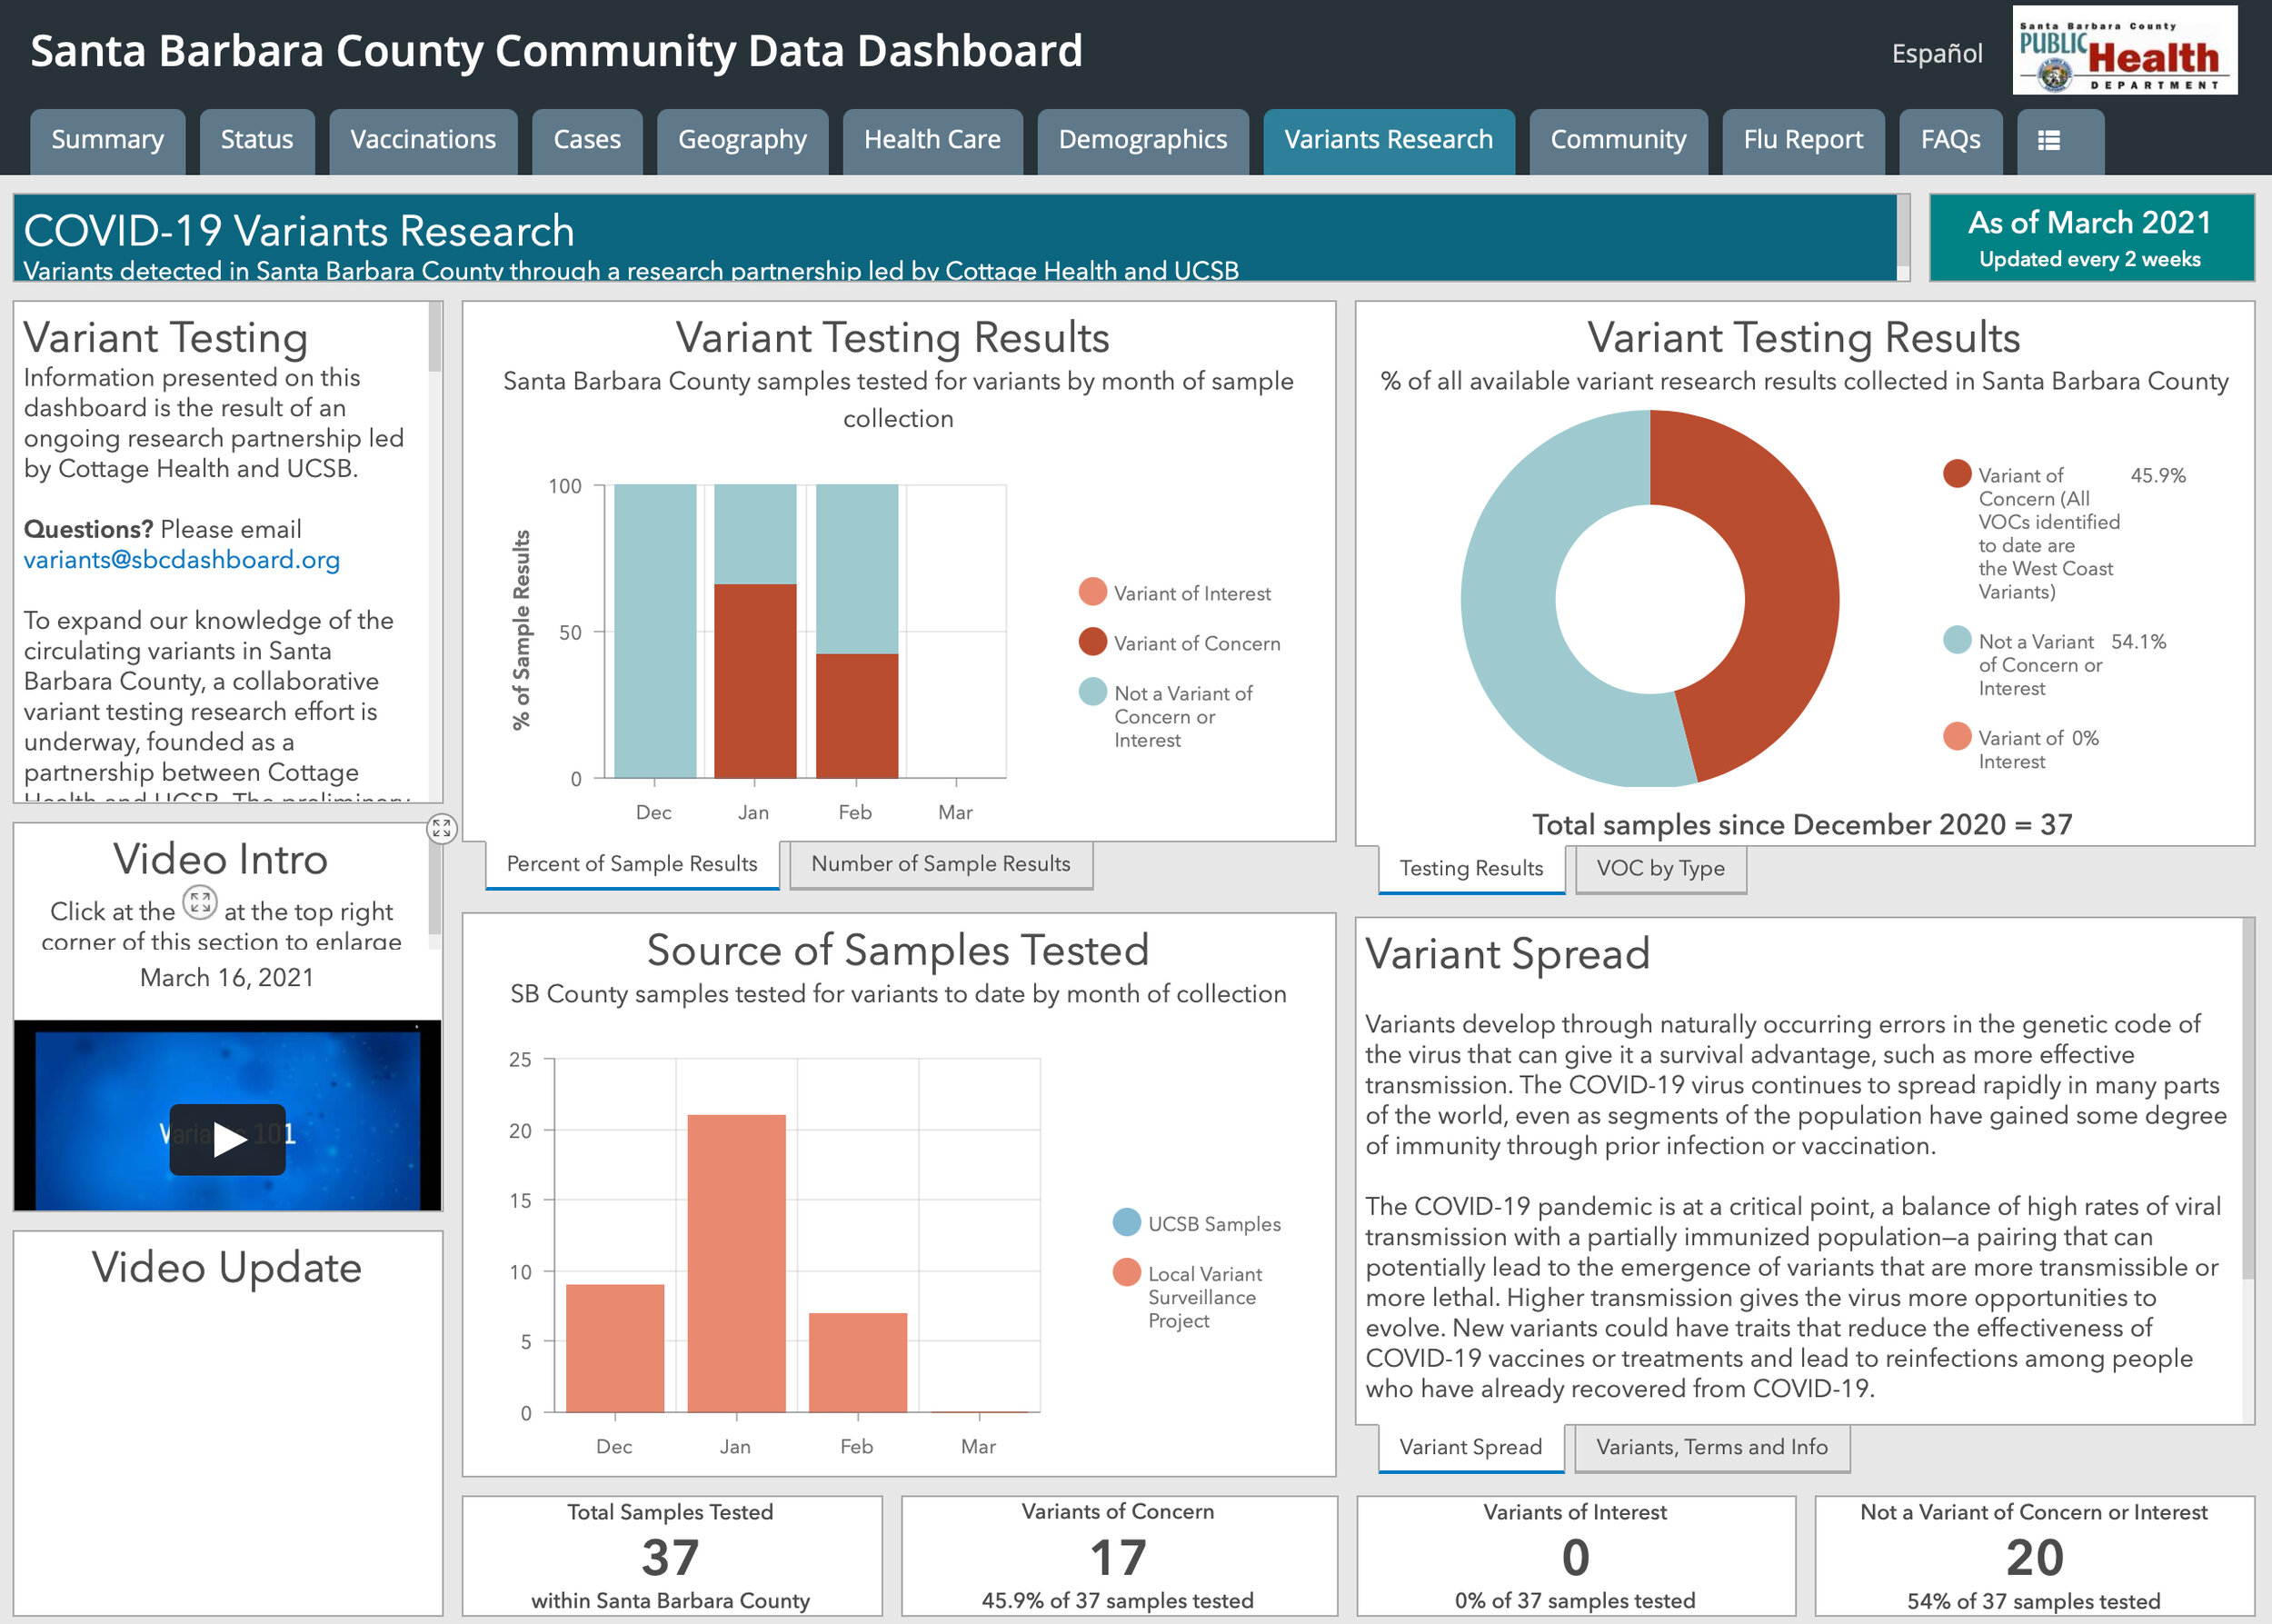
Last week was a big week for the Santa Barbara Community Data Dashboard. Santa Barbara County’s adjusted case count was 7.7 per 100k residents, and we officially moved into the red tier after months in the most restrictive purple tier. That represents a huge achievement compared to the case counts since October. Looking forward, we launched a new dashboard to track the prevalence of Variants of Concern in the County, just as news broke that the CDC has designated the West Coast Variant a “variant of concern” and that the first case of the Brazil or P1 variant of concern in California was reported in San Bernardino County.
The pandemic has arguably become a race between vaccinations and variants, with vaccinations critical to keeping the spread of more contagious and more impactful variants of COVID from driving another spike in case counts here. The dashboard is now tracking both critical elements of what we hope is the final leg of this marathon.
We’re able to do so thanks to Cottage Health and UCSB, the lead partners on a new research initiative that arguably puts Santa Barbara in the top tier of counties across the country in terms of our capacity to track variants through full genomic sequencing in real time. And we have the leadership of infectious disease doc, Dr. Lynn Fitzgibbons of Cottage Health, and virologist, Dr. Carolina Arias Gonzalez of UCSB, to thank for this remarkable partnership. We are thrilled to partner with them as the communication platform for this critical information, and we’re working to help raise the funding they need to sustain and expand their work. If you’d like to support this critical work, or if you have questions about the variants dashboard, please email variants@sbcdashboard.org or reply to this email and I’ll help make the connection.
We’re grateful for the expanding community partnerships that enable sbcdashboard.org to keep adapting to meet the community’s needs. As we face increasingly complex challenges and compounding crises, we are going to need these kinds of collaborations more and more. We believe the dashboard can be an engine of that kind of collaboration, starting with data sharing and moving on to partnerships to move the needle on key metrics. We have been working with an array of local nonprofits, funders and county leadership to identify other key community needs that the dashboard can help address. We’d love to partner with you too and welcome hearing your ideas and exploring possibilities together.